We can unanimously say that we live in a time of digitization, significantly accelerated due to the COVID-19 epidemic, where even the most staunch advocates of shopping in physical stores had to move to the internet. Consumers have become much more demanding than ever. Most of them visit our websites using smartphones, and the way they use them does not compare to our competitors, only to the best applications available on the market, on which they spend the most time.
This state of affairs significantly increases competition, where even 1 second is crucial. When waiting for the application to load, even 1s is very important and may cause the user to leave our website before it is loaded. The matter is not made easier since the size of websites and applications has been growing continuously since 2011 and currently amounts to 2063.1KB for desktop applications and 1900.0 KB for mobile applications.
Today, we can boldly say that caring for Web Performance Optimization (WPO) at the highest level is caring for our users and the business.
Performance really matters for your users
Performance is crucial to our users. According to research, the probability of leaving the website after 1-3 seconds of waiting for its loading increases by 32% and by 90% while waiting up to 5 seconds (source). Not falling within this range, we lose nearly half of the potential users. It may seem crazy, but research shows that the waiting time of a mobile user for content to load can cause him to stress similar to what manifests itself when watching a horror movie.
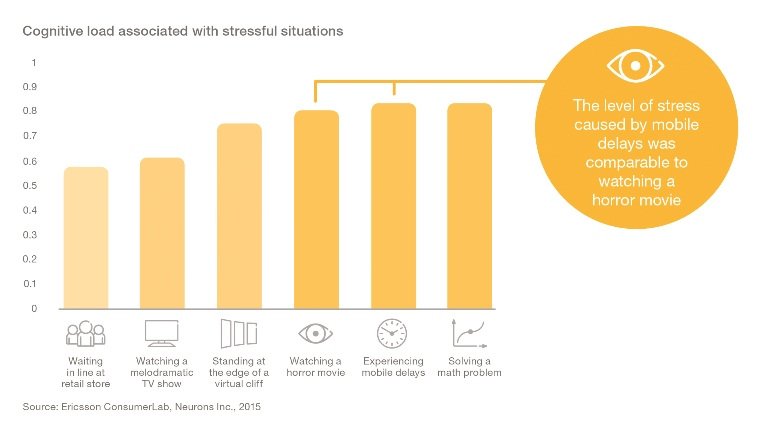
It mainly affects mobile users due to the computing power limited compared to computers and the Internet speed that varies depending on the location. All this clearly shows that every second matters here.
Performance really matters for your business
If we ensure that users do not leave us before they see what we have to offer, our business will have to grow. It is how performance, translated into user experience, affects our business. Among the pages that load within 5s, there was 2 times higher profit compared to pages that loaded almost 19s (source). Following the example of Vodafone – by implementing A / B testing focused on Web Vitals optimization resulting in a 31% improvement in Largest Contentful Paint (LCP), they achieved the following results.
31%
A 31% improvement in LCP led to…
+8%
Increase in total sales
+15%
Uplift in the lead to visit rate
+11%
Uplift in the cart to visit rate
Vodafone is no exception, there are a lot of such examples (source).
Performance improvements aren’t just technical wins—they translate directly into business outcomes: better conversion rates, lower bounce rates, and increased customer satisfaction. Optimizing load speed means optimizing your product’s success metrics.
🗣️ Book a free consultation with our migration experts. Let’s talk about where your application stands today and how to get it where you want it to be, without the costly mistakes.
Where to start?
Product owners should also align performance goals with business KPIs. Understanding which metrics (like conversion rate, user retention, or engagement) tie to Web Vitals helps prioritize performance work on the roadmap.
Initially, we should focus on measuring our Core Web Vitals. Despite their short service life, various tools can already be used and the list is constantly growing. Here are some of the most used:
- Chrome User Experience Report: This report can be used to measure Core Web Vitals based on field data from real users who have opted in to allow Chrome to collect and share this data.
- PageSpeed Insights: This tool can be used to measure Core Web Vitals using field data sourced from the Chrome User Experience Report as well as lab data collected and analyzed by Google in a controlled environment.
- Core Web Vitals report on the Google Search Console: the Google Search Console provides a Core Web Vitals report for each of your registered web properties.
- Chrome DevTools: starting with Chrome 88, the DevTools Performance tab includes a Web Vitals lane that displays some of the Core Web Vitals scores.
- Lighthouse: Lighthouse 6.0 (also available in Chrome DevTools) can generate reports that include Web Vitals metrics.
- web-vitals: This is a JavaScript library that can be integrated into your web app. It includes a simple set of functions that capture Core Web Vital events and data.
- LogRocket: LogRocket correlates Web Vitals metrics with business impact. In addition to monitoring Web Vitals, LogRocket monitors page load times, CPU/memory usage, browser crashes, and React component rendering.
The main attributes we should focus on are:
- First contentful paint (FCP): measures the time from when the page starts loading to when any part of the page’s content is rendered on the screen. (lab, field)
- Largest contentful paint (LCP): measures the time from when the page starts loading to when the largest text block or image element is rendered on the screen. (lab, field)
- First input delay (FID): measures the time from when a user first interacts with your site (i.e. when they click a link, tap a button, or use a custom, JavaScript-powered control) to the time when the browser can respond to that interaction. (field)
- Time to Interactive (TTI): measures the time from when the page starts loading to when it’s visually rendered, its initial scripts (if any) have loaded, and it’s capable of reliably responding to user input quickly. (lab)
- Total blocking time (TBT): measures the total amount of time between FCP and TTI where the main thread was blocked for long enough to prevent input responsiveness. (lab)
- Cumulative layout shift (CLS): measures the cumulative score of all unexpected layout shifts that occur between when the page starts loading and when its lifecycle state changes to hidden. (lab, field)
How Angular might help us with that?
In recent years, Angular has taken many steps to improve the application loading speed. It manifests itself in reduced bundle size, improvements in Server-Side Rendering (SSR), which allows us to significantly influence SEO and First Contentful Paint (FCP). Below I will try to present a few solutions that can help us improve the performance of our website.

If you are curious how Angular performs in real-world scenarios, check out our company’s case study to see how we successfully applied Angular in a complex, large-scale project, and what lessons we learned along the way.
Critical CSS inlining
Along with the 11th version, Angular received support for critical CSS inlining, which also significantly influences the already mentioned FCP, as evidenced by the example below, showing the comparison of loading of the same page with “render-blocking CSS” and then with the use of “critical CSS inlining “. The picture below clearly shows the impact of this approach on FCP.

(Comparison of loading a page with render-blocking CSS (top) and the same page with inlined critical CSS (bottom) on a 3G connection – Source).
Define your js budget’s
In the context of performance, it is equally important to define and control the appropriate budgets. We can use an online budget calculator to estimate how much JavaScript our application can load, depending on what Time to Interactive (TTI) we want to achieve. Once we get the appropriate values for our requirements, we can easily define them inside angular.json.
"budgets": [{
 "type": "bundle",
 "name": "main",
 "maximumWarning": "170kb",
 "maximumError": "250kb"
}]
Summarizing what was specified:
- We define a budget for a JavaScript bundle named main.
- If the bundle exceeds the size of 170 KB, Angular CLI will show us a warning in the console when building the application.
- If the bundle size exceeds 250 KB, the building of the application fails.

Sample warning and error (source)
We can also supervise our budget using Lighthouse and CI. (source)
Server Side Rendering
Normally Angular application executes in the browser, rendering pages in the DOM in response to user actions. Server rendering generates the full HTML for a page on the server in response to initial navigation. It avoids additional round-trips for data fetching and templating on the client since it’s handled before the browser gets a response. Thanks to the Angular Universal we can implement mentioned functionality to any Angular application. It means that the application renders faster, giving users a chance to see the application layout before it becomes fully interactive. In addition to these benefits, the following three reasons for using the SSR seem to be of key importance:
- Facilitate web crawlers through search engine optimization (SEO)
- Improve performance on mobile and low-powered devices
- Show the first page quickly with a first-contentful paint (FCP)
Additionally to all of the mentioned possibilities, we can consider deploying all of the static assets and pages of our app to the AWS S3, which in addition to the Amazon CloudFront can extremely improve the performance of our app. It will store a cached copy of our static site or assets all around the world, delivering it to our users from the nearest location to reduce latency.
In addition to the mentioned ways to improve page load times, there is a whole host of practices and methods that Google provides and recommends to follow. The number of recommendations presented in the attached source indicates how much also depends on the developer.
Modernizing with Angular isn’t just about faster load times—it’s about choosing a scalable framework that supports long-term innovation and growth.
Take a look at our other article, where we explain what types of projects Angular is suitable for.
Source
https://blog.logrocket.com/google-web-vitals-single-page-apps/
Summary
Modernizing your frontend isn’t just about keeping up with technology—it’s about driving measurable business value. Faster, better-optimized applications lead to higher user satisfaction, better retention, and improved conversion rates. Frameworks like Angular offer built-in capabilities that not only enhance performance but also make development more efficient and scalable. For business and product owners, the key takeaway is that performance should be treated as a strategic asset. When aligned with business goals and carefully measured, frontend improvements become a catalyst for growth—not just a technical upgrade.


 5 min
5 min